
Before you begin
You need access to the survey’s results and the view you want to use: Heatmap or Hierarchy. Available groups and controls depend on the survey and your access. The Heatmap example below uses Department → Engineering and Sales in Demo Organization.Open the heatmap
- In Survey Hub → Active Surveys, open your survey’s results: select Analyze or the survey’s row. Results are available after the survey closes.
- Select Heatmap in the survey navigation. If needed, open More to find it.
- Confirm the survey name and any active filters. In the value menu above the grid, choose Score to compare the displayed scores.
Choose the rows and comparison groups
- Use the row selector above the grid to choose Question Groups or Questions.
- Open the column selector beside it. Its label reflects the selected category, such as Department, or says No columns when nothing is selected.
- To start a fresh selection, choose Clear all in the Heatmap columns picker. This clears comparison columns; it does not clear separate audience filters.
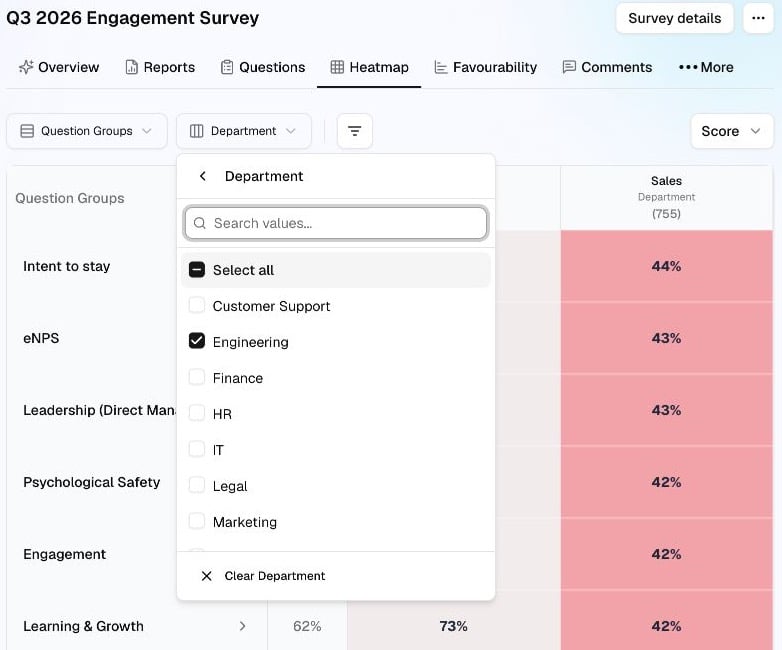
- Open a category such as Department, then check the groups you want to compare. Use Search values… to find a group in a long list.
- Click outside the picker and wait for the grid to finish updating. Check the column headings to confirm your selection.
Read the comparison
Read across one row to compare the same question or question group for the selected groups. Check the column names, displayed counts and score values before drawing a conclusion.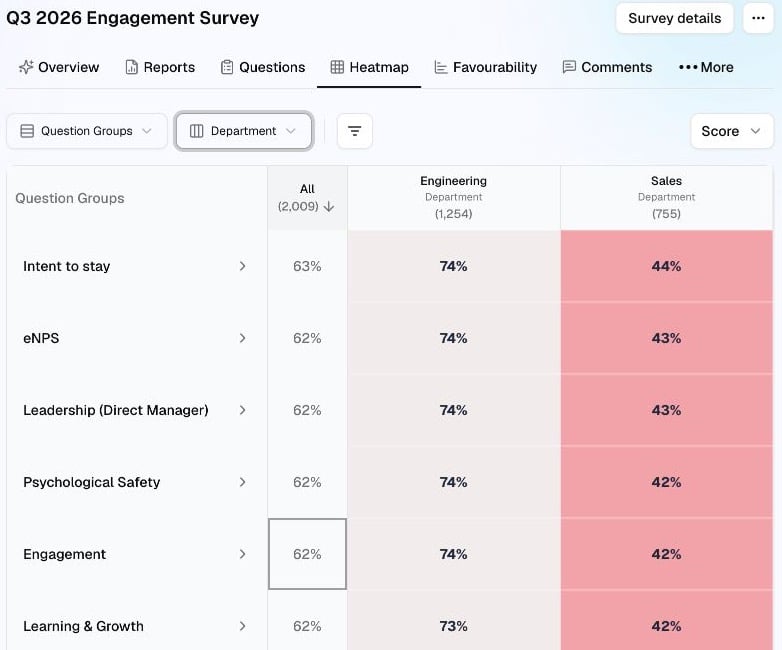
Watch: compare two departments
This 25-second silent example sets the rows to Question Groups, opens the column picker, chooses Clear all, then selects Department → Engineering and Sales. It ends on the comparison, where All now covers only the selected groups. Innerlogic Sandbox example. Follow the written steps above for the same workflow.Change or clear the comparison
- Reopen the column selector and category, then check or uncheck individual groups.
- Use the back arrow inside the picker to return to the category list. Choose Clear all there to remove all comparison columns.
- If the grid says No columns selected, choose Choose columns and select groups to display again.
Explore a reporting hierarchy
The Hierarchy view must be available for your survey and access. Its reporting groups are different from the tag-based columns in Heatmap.- Select Hierarchy in the survey navigation, or look under More.
- Check the current leader shown above the results. Under Leaders, select an available leader row to open that reporting branch.
- Use the breadcrumb above the results to return to an earlier level.
A leader can have different results for their direct reports and their full hierarchy. Use the displayed scope and counts together; do not treat those groups as interchangeable.
Compare leaders side by side
Where Add to comparison is available:- In the Leaders table, select Add beside at least two leaders. You can also add the current leader using Add to comparison above the scores.
- Check the selected names in the selection bar, then select Compare leaders.
- Choose Full hierarchy or Direct reports above the comparison table. Wait for the displayed scores and counts to update.
- Read across the same row to compare overall or question-group scores. Select a question-group name to expand its questions; select it again to collapse them.
- Select Back to hierarchy to return to browsing. Use Clear in the selection bar to remove the selection and start again.