
Open the right survey
Open Survey Hub → Active Surveys and select the survey’s row, or Analyze if your survey list offers it. Results are available after a survey closes; while it is open, you’ll see a response snapshot instead. Check the survey name before continuing: similar names can refer to different listening periods or audiences.Switch between results views
- Find the survey name above the results. The navigation directly below it belongs to this survey.
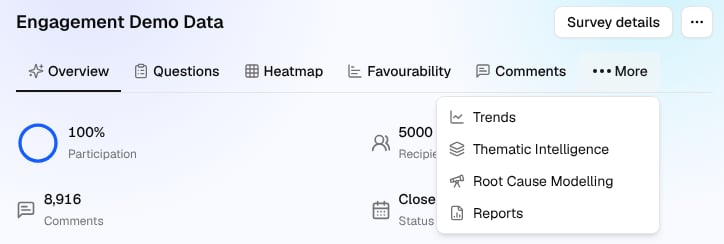
- Select a view such as Questions or Heatmap. If it is not visible, open More in the same navigation row and choose it there. More views move into this menu when the screen is narrow.
- Wait for the page to finish loading. Confirm the selected view, survey name and any active filters before using the results.
Read the survey overview
- Select Overview in the survey navigation and confirm the survey name.
- Read Status and the date shown. For a closed survey, check Participation and Recipients to understand the participation summary. These figures cover the people whose results you can access, not the response count for each question.
- Read the available summary content as an introduction, then open Questions to inspect individual scores and distributions. Summary content can vary by survey and access. Some summaries, such as the Nora briefing, are written automatically by Nora AI. Check them against the scores and comments before relying on them.
- To read written feedback, select the Comments total when it is available as a link, or use Comments in the survey navigation. Follow Use the Comments tab to search and filter the list.
Watch: get around the dashboard
This 26-second silent example reads the participation figures on Overview, scrolls past the summary, then opens Questions and Heatmap and returns to Overview. Innerlogic Sandbox example. Follow the written steps above for the same workflow.Choose your next step
For a prepared report, follow Find your report to check its audience, status, and version before opening the PDF.
For response counts, score labels and favourability charts, follow View scores and distributions.
Return from a detailed result
After opening a question or group, select Questions in the survey navigation to return to its results table. Select Overview to return to the survey overview, or use another view in the same navigation row to continue exploring this survey. To choose a different survey, return to Survey Hub → Active Surveys and open that survey’s results. On a narrow screen, use Toggle Sidebar to open the sidebar first. Check the new survey name before continuing.Filter results and check the selected audience
The steps below use Questions. You need access to the survey’s results. Available categories and values depend on your access and the survey; the example uses Department → Engineering in Innerlogic Sandbox.Watch: filter by department
This 21-second silent example opens Questions, switches from question groups to individual questions, and selects Tags → Department → Engineering. After closing the menu, check the selected-filter label above the results. Innerlogic Sandbox example. Follow the written steps below for the same workflow.Choose the audience
- Open Questions in the survey navigation.
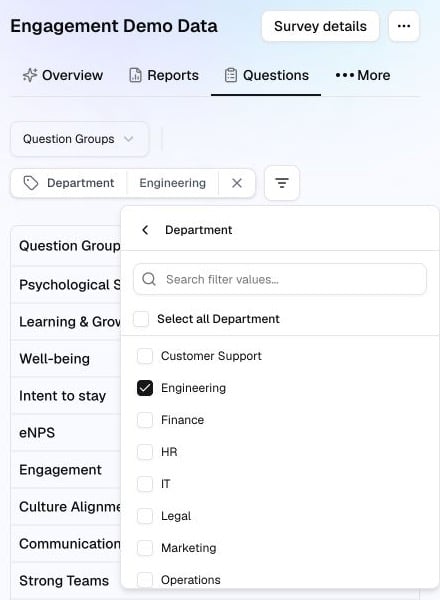
- Select the filter icon above the results. It has no text label; its screen-reader name is Filters.
- Select Tags, then a category such as Department.
- Check the value or values you want to view. Use the search field to find a value in a long list.
- Click outside the menu and wait for the results to finish updating. There is no separate Apply step in this picker.
Confirm what you are viewing
Read the selected-filter labels above the results before interpreting the page. In this example, Department — Engineering shows the selected audience. If a label shows 2 values instead of names, select it to inspect the checked values. The displayed results update for the selected audience within the results available to you. For example, a score can change when you select a department. Check the survey name, every active filter and any loading or error message before using the results. When moving to another analytics view, check that page’s controls and active selections again. For a prepared PDF report, check its own audience as described in Find your report.Change or clear the selection
- Select a filter’s value label to reopen its choices, then check or uncheck values.
- Select the × beside a filter to remove that filter.
- To clear your audience selections, remove each active filter and wait for the page to refresh. Confirm that the selected-filter labels have disappeared. Clearing filters does not grant access to additional results.