
Before you begin
You need access to the survey’s results. Open the survey’s results from Survey Hub. Confirm its name and check the selected audience. Recheck filters when you switch views. The examples below use the Communication question group in Innerlogic Sandbox. Your questions, scales and available views may differ.Find a question’s response count and score
- Select Questions in the survey navigation.
- In the selector above the table, choose Question Groups if it is not already selected. The Score column summarizes each group’s results for the current filters.
- Select a group, such as Communication. Its Distribution view opens.
- In the group’s view selector, change Distribution to Questions.
- In Question Breakdown, find your question. Read the responses label below it and Score on the right. Select the question to open its details.
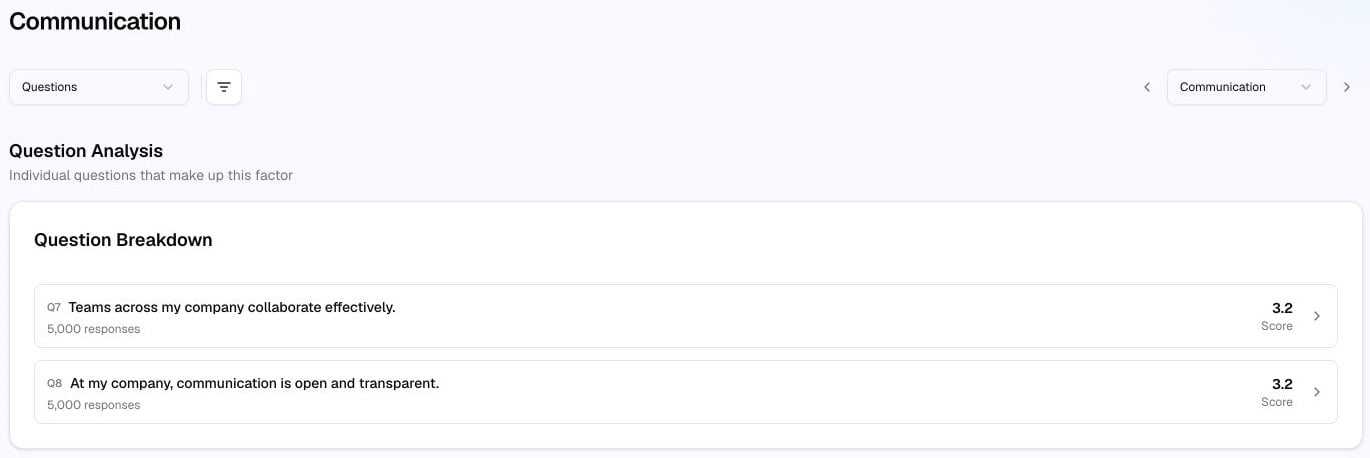
Sort questions with the arrows
- Open Questions in the survey navigation, then choose Questions in the selector above the table.
- Select the Score column heading or its up/down arrows to sort the rows by score. Select it again to reverse the order: lowest to highest, or highest to lowest.
- To find a question by name, select Question to sort alphabetically; select it again to reverse the order. Question Group and Change also have sorting arrows.
- Select a question’s row to open its details. Return with Questions in the survey navigation.
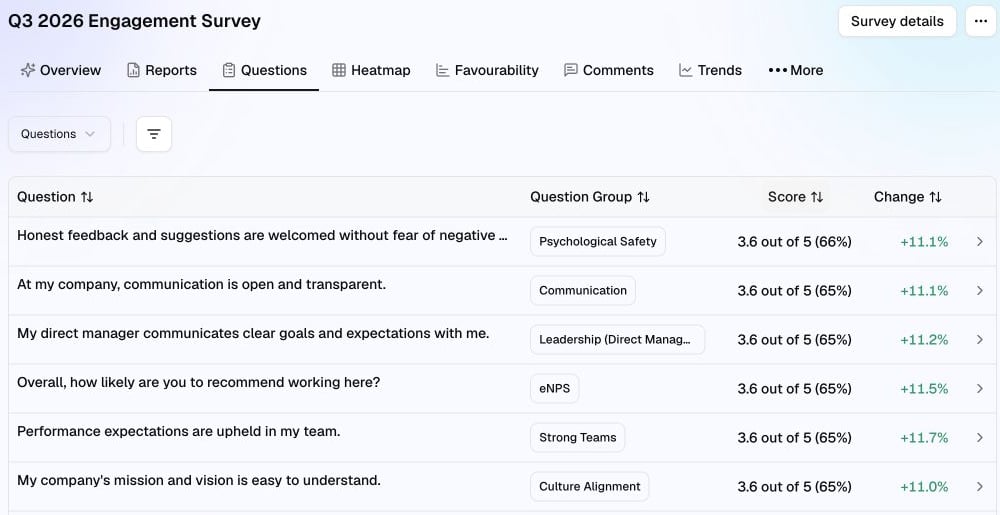
Watch: sort questions and open a result
This 23-second silent example opens Questions, selects individual questions, sorts them by Score in both directions, and opens a question to view its score distribution. The recording uses Innerlogic Sandbox.Read the score and distribution
In the question’s Overview view, read Average score, then Score Distribution below it.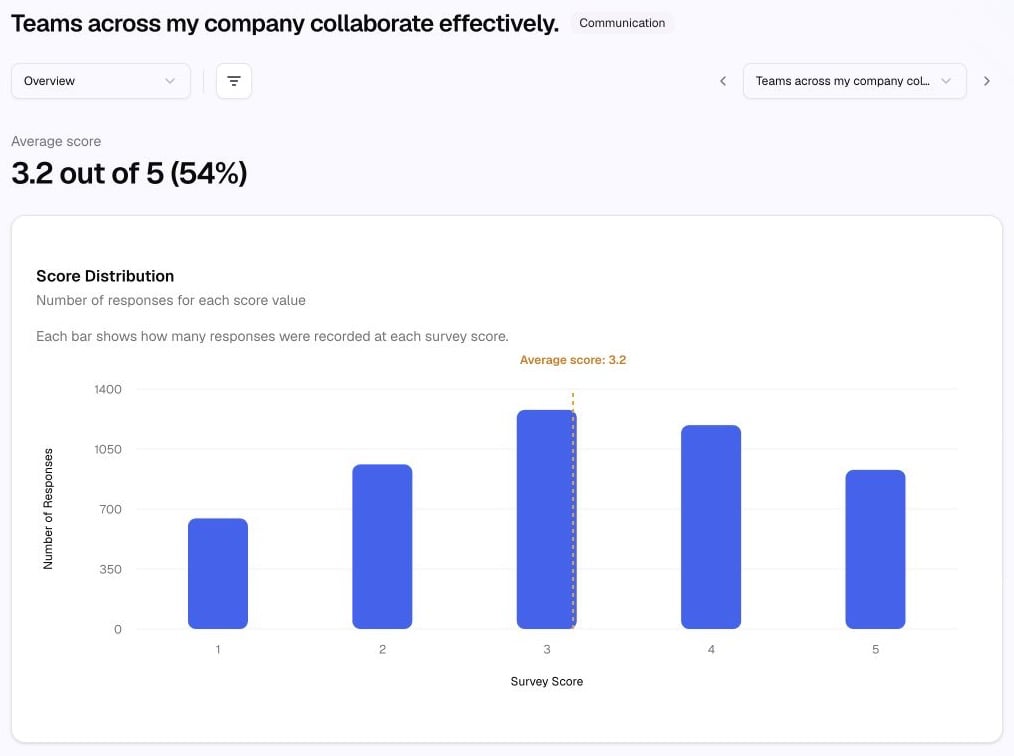
For a question group, choose Distribution in its view selector. The group chart is labelled as a normalized 0–100 scale. Check the chart’s labels each time rather than assuming every chart uses the question’s original scale.
Use the question or category selector, or its adjacent arrows, to move between results. Check the new title and filters before reading the next chart.
Switch to favourability
- Select Favourability in the survey navigation.
- Use the selector above the table to choose Question Groups or Questions.
- Find the relevant row. Match its coloured bar to the legend: Unfavorable, Neutral, and Favorable.
- Read % Favorable at the right for the share classified as favourable in that view.
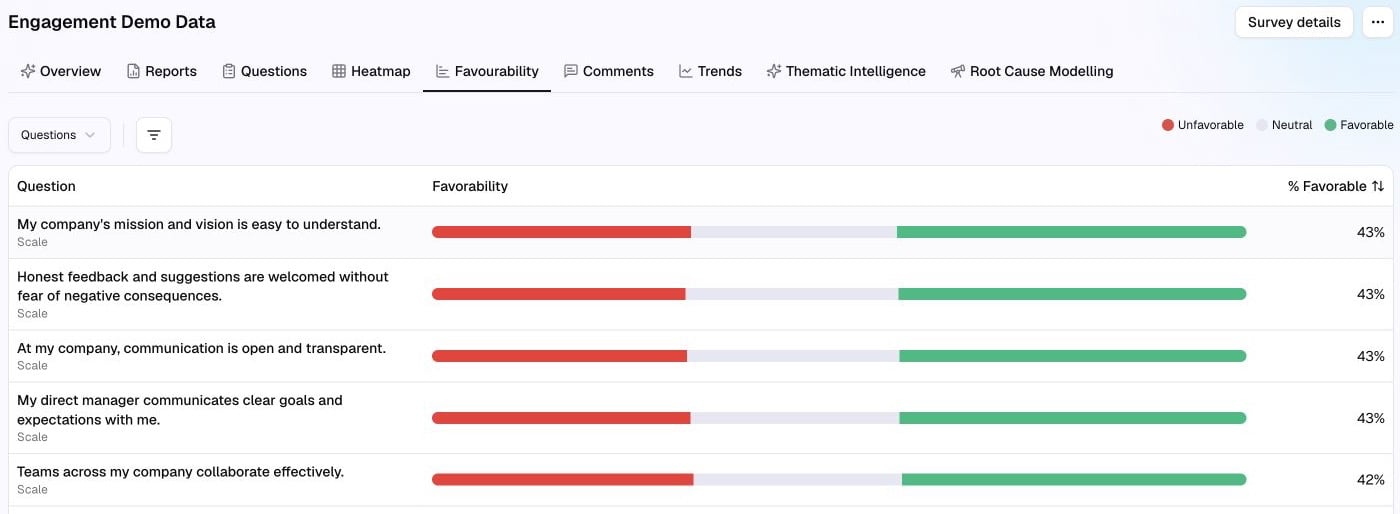
Watch: switch to favourability
This 17-second silent example opens Favourability, switches the selector from Question Groups to Questions, then points to the colour legend and a question’s % Favorable value. Innerlogic Sandbox example. Follow the written steps above for the same workflow.If a number or view is missing
- Check the selected question or group, active filters, and any message on the page. Different question types can offer different views.
- Treat a dash, hidden result or unavailable value as unavailable, not zero. Do not reconstruct hidden counts or distributions.
- In the Questions table, Change refers to the difference from a previous survey score. A dash doesn’t mean the score stayed the same.
- If the expected view is still missing, follow Troubleshoot sign-in and access and ask your administrator to confirm access and configuration.